Design Signatures - Outputs
The results include a text file and a zipped folder. These outputs are described separately below:
The tab-delimited text file contains a row for each of the top 100 primer pairs that meet all of the input constraints specified by the user. An example output file can be found here, for the example input FASTA file. The titles and contents of the output columns are as follows:
- forward_primer/reverse_primer:
The sequence of each forward and reverse primer (5' to 3') with IUPAC ambiguity codes to represent multiple permutations.
- score:
The score of the primer pair, where higher is better. The score is important for comparing between primer pairs on a relative scale. For example, the score can be used to compare between results obtained with different input parameters.
- coverage:
The fraction of groups (i.e., alleles) that will be efficiently amplified using the primer pair.
- products:
The number of PCR products that were amplified in each group. Note that groups comprised of many sequences will likely contribute several amplicons to the number of products.
- similar_signatures:
A list of groups (if any) with similar (or identical) signatures are listed in parentheses separated by semicolons. For example, "(G1, G2); (G3, G4, G7)" indicates that the signature for group G1 is similar to the signature for G2, and, likewise, group G3 to G4 and G7.
- missing_signatures:
A list of groups (if any) that will not amplify with high efficiency, and therefore might be missing a signature.
- enzyme:
If applicable, this column will contain the restriction enzyme used to digest the PCR products, or will be empty where none was used.
- digest_score:
If applicable, the equivalent score for amplicon diversity after digestion using the restriction enzyme. This is typically substantially larger (better) than the pre-digestion "score".
- fragments:
If applicable, the number of fragments generated from the "products" after digestion with the restriction enzyme.
The zipped folder contains pdf files for each of the top 20 primer sets. The pdfs contain plots of the predicted results of using the primer set (and enzyme, if applicable) in an experiment. Note that long group names are abbreviated for display. Representative plots for each type of experiment are shown below:
- All experiments:
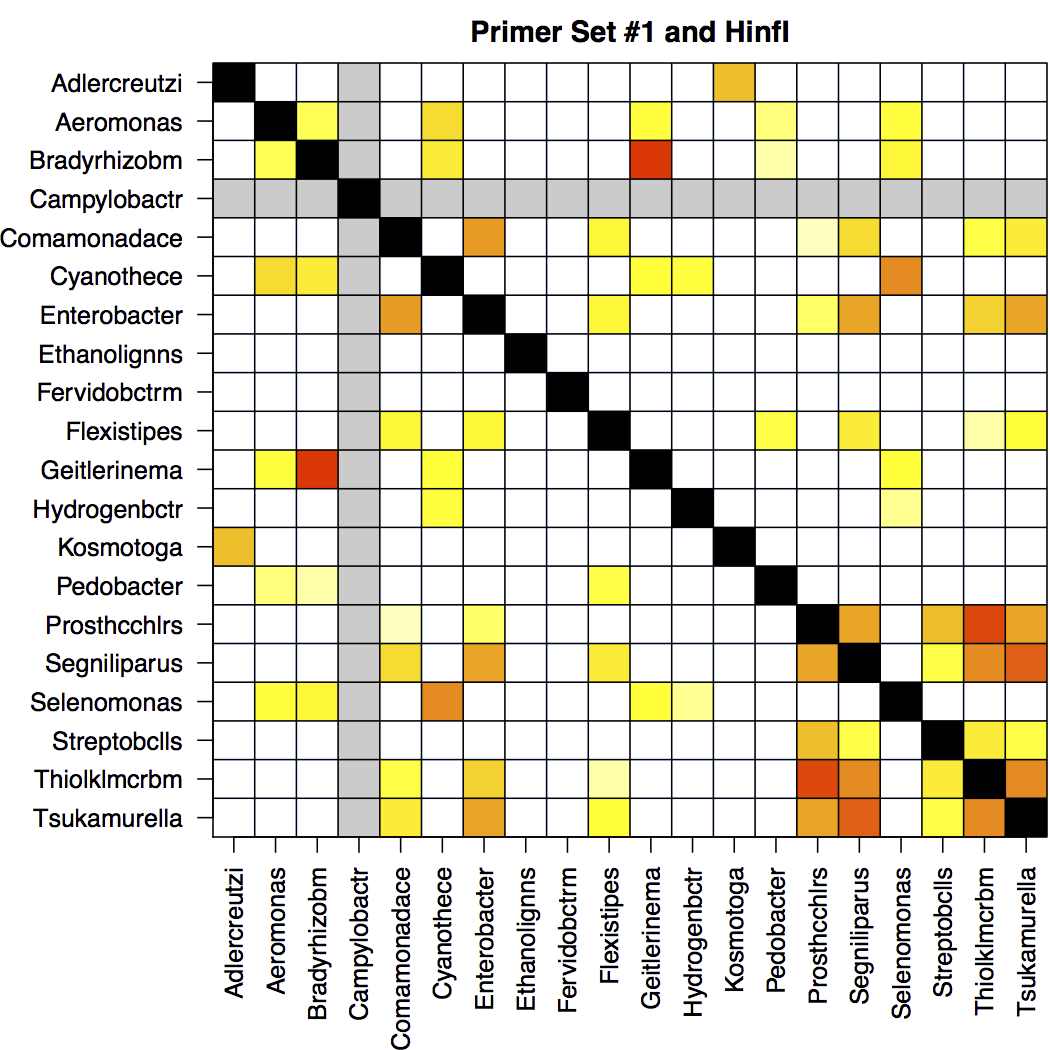
A critical question in assessing the designed primers is which groups (i.e., sequence variants) will have indistinguishable signatures. For the top 20 primer sets, Design Signatures outputs a heatmap showing unresolvable groups and groups without signatures. The heatmap is symmetric, and the diagonal is black to indicate a group compared to itself. Columns/rows in gray indicate groups that will not amplify with high efficiency using this primer set, and therefore might be missing a signature (e.g., Campylobacter in this example).
White boxes are ideal, because they indicate that the signatures for each group are distinct. Red boxes occur at the intersection of groups that will yield very similar or identical signatures and therefore will not be resolvable. Orange boxes indicate groups that are predicted to have similar, but distinct, signatures and may be resolvable if the experiment is performed at high resolution.
- Sequencing experiments:
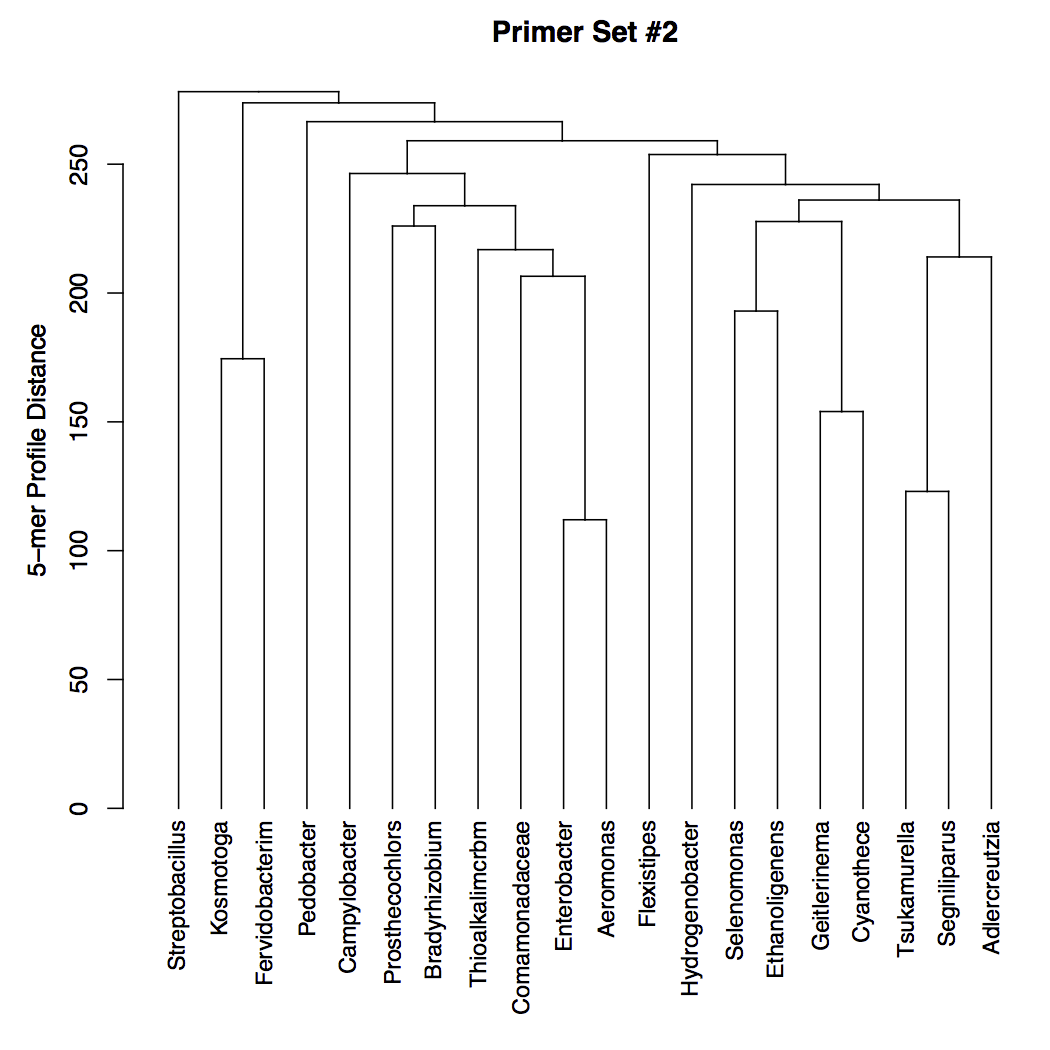
The plot below shows a dendrogram of the 5-mer distances between each group. Note that this is not a phylogeny and cannot be interpreted as such. The ideal output would have a very large distance between all of the groups, as shown here. Groups separated by a (vertical) branch length of zero will be indistinguishable in the experiment.

- High Resolution Melting experiments:
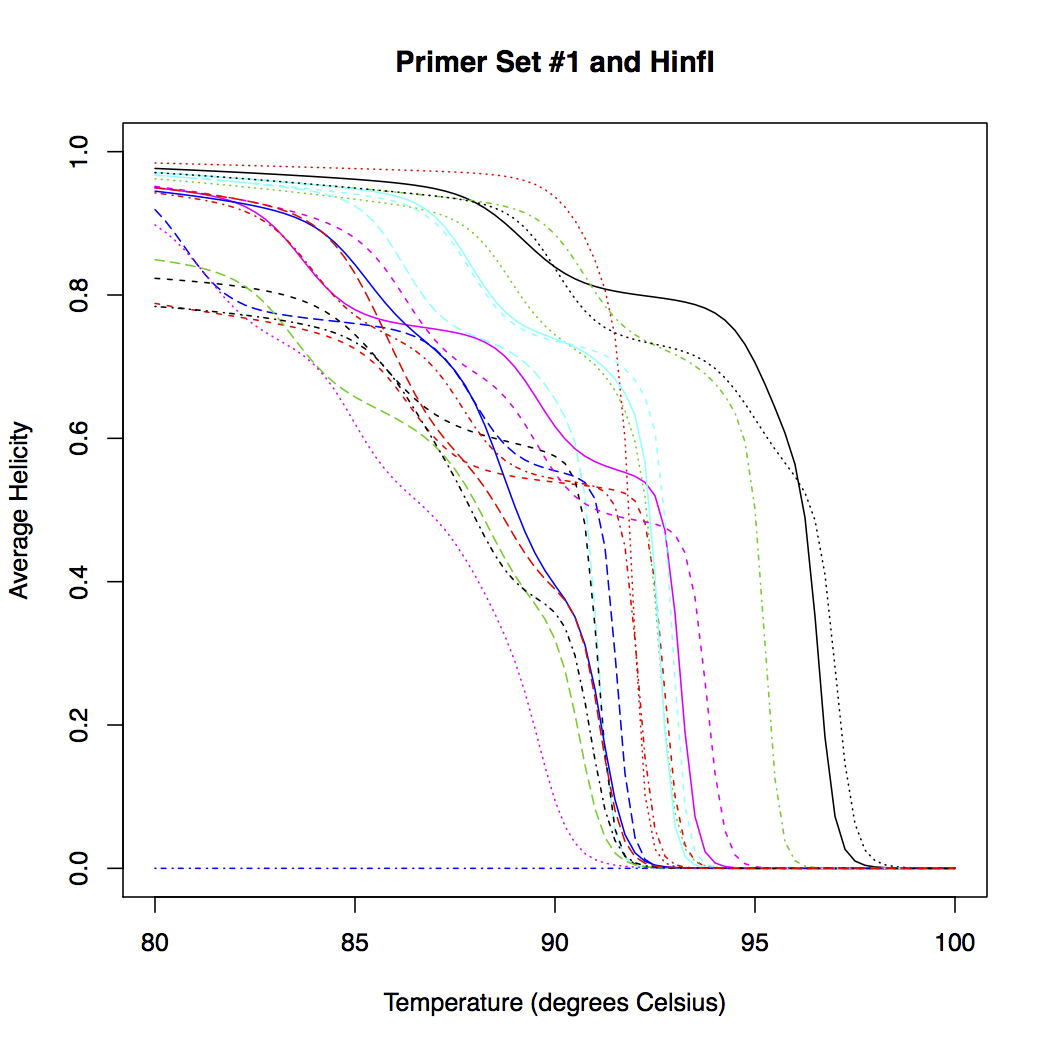
The plot below shows the predicted melt curves for all of the input groups. In the case shown here, the melt curves are post-digestion with the restriction enzyme HinfI. The ideal output would have a large separation between all of the melt curves. Identical or very similar curves will be indistinguishable experimentally.

- Fragment Length Polymorphism experiments:
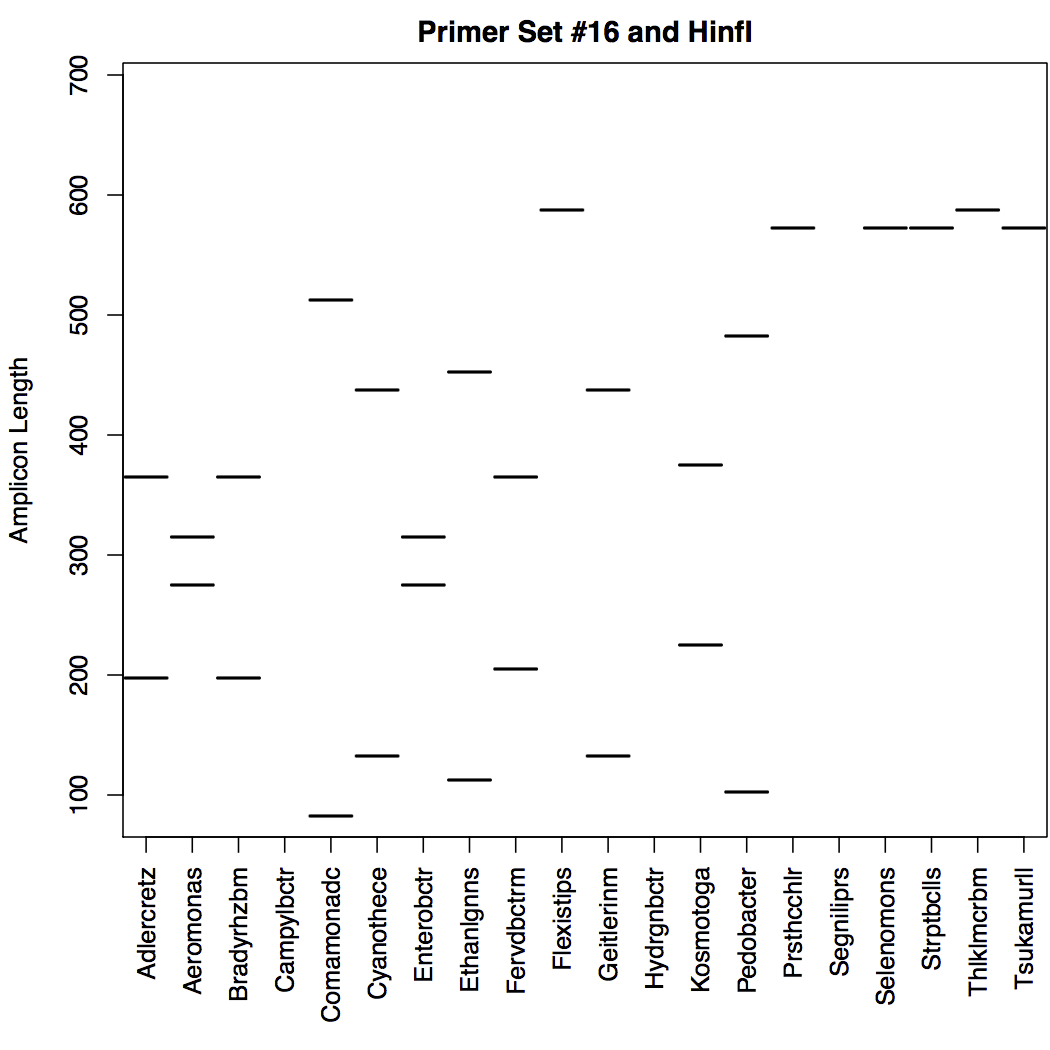
The plot below shows the predicted length bands for each group. In the case shown here, the bands are after digestion with the restriction enzyme HinfI. Note that there are multiple bands in the same vertical column for some groups, because more than one fragment will exist after digestion. The ideal output would have well separated bands with distinct banding patterns. Note that several of the groups shown here have identical bands, and would therefore be indistinguishable using this primer set and enzyme combination.
